[AlbaTherium] OptiStruct™ Premium for Smart Money Concepts An Insight into Structure Mapping and Order Block Identification with Smart Money Concepts
Introduction:
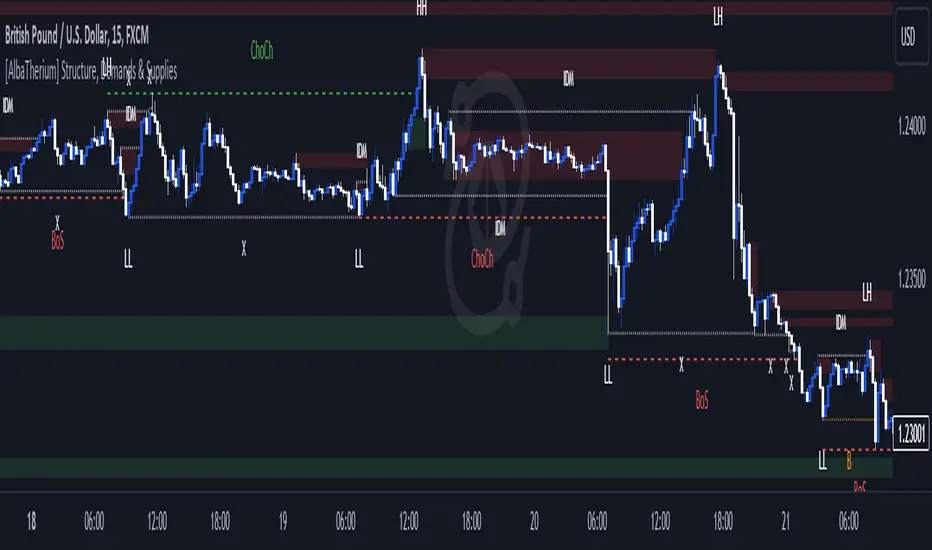
Structure Mapping & Demands and Supplies Premium serves as a fundamental pillar in the realm of Smart Money Concepts . This indicator adeptly charts the market structure based on a refined version of SMC while identifying Order Blocks. All the concepts embedded in this method are meticulously defined, offering users the ability to chart the market structure with precision and heightened confidence. With this indicator, there is no need for excessive questioning of the accuracy of your markings; it diligently strives to perform this task effectively. There are no hidden 'magic' properties underlying this indicator, ensuring that our users can independently verify each and every feature. It is this commitment to transparency that sets us apart and makes us unique in the market.
In this discussion, we delve into the intricacies of Break of Structure, Change of Character , and SMART MONEY TRAP . We also introduce the concepts of Extreme Order Blocks, Decisional Order Blocks , and Smart Money Trap Order Blocks .
Chapter 1: Understanding Structure Mapping:
Let's begin with some definitions:
- Inside bars are candles that lie within the range of a preceding candle.
- Pullbacks occur in an uptrend when the low of a preceding candle's range (excluding inside bars ) is breached, and the price continues to rise.
- Inducements (IDM) are price levels defined as the low of the latest pullback before the most recent high. They often act as liquidity points that the market revisits before continuing its move.
Break of Structure (BoS):
In an uptrend, after surpassing an IDM , the most recent high becomes a Confirmed structure high, or a Major High . If the price then closes above this Major High, a Bullish Break of Structure (Bullish BoS) is confirmed. Similarly, the lowest point between these movements becomes a Confirmed structure low or Major Low in a downtrend.
Change of Character (ChoCh):
In an uptrend, if the price falls below a Major Low, it indicates a shift in market bias from Bullish to Bearish, or a Bearish Change of Character .
Example of a bullish ChoCh:
Chapter 2: The Significance of Order Blocks:
Order Blocks (OB) play a pivotal role in Smart Money Concepts during entry points. Understanding what they represent and how to identify them is essential. For a Bullish/Bearish Order Block to be confirmed, specific conditions, including price imbalance and breaching the previous candle's high or low, must be met. We will delve into the finer details of identifying and trading Order Blocks, with an emphasis on the fact that price often reacts from Decisional Order Blocks, Extreme Order Blocks , and Smart Money Trap Order Blocks .
An OB is the initial candle range of a pullback that creates a Fair value gap.
These are zones where proactive traders enter the market, resulting in significant price changes indicated by Fair value gaps. It is believed that when the price revisits these zones in the future, it tends to bounce back. This property makes Order Blocks excellent potential entry points.
Order Blocks are categorized as follows:
- Extreme OB : The first and lowest OB between the Major Low and Major High.
- Decisional OB : The most recent OB lower than the current IDM.
- Smart Money Traps : All OBs between Extreme and Decisional OB.
- Demand above IDM / Supply below IDM
Chapter 3: Understanding SMART MONEY TRAP (SMT):
SMART MONEY TRAP is a concept that brings clarity to the distinction between Structure and Order Blocks within Smart Money Concepts and is a unique feature of this indicator. While many Smart Money Traders base their trades on Structure and Order Blocks, it's crucial to recognize that Order Blocks serve as an additional confirmation for buy or sell decisions. Blindly trading based on Order Blocks is not advisable. Instead, traders should exercise patience and await other confirmations like inducement or Liquidity sweep before executing trades on Order Blocks. We will illustrate how this concept works in practice.
In the example above, the market made a high wick up, taking out the buy-side liquidity, then made a bearish ChoCh. We place our sell order on the order block above IDM. This presents a promising trading opportunity, with a stop loss placed above the OB and a take profit set at the low of previous structure.
Conclusion:
Structure Mapping & Demands and Supplies Premium as the epitome of Smart Money Concepts, presenting traders with a tool meticulously crafted for an exceptional user experience . This indicator integrates structural mapping and Order Blocks, providing not only a wealth of knowledge but a platform tailor-made for personalization to suit your unique style and preferences. By mastering the nuances of Impulsive Moves and Corrections, and expertly identifying and trading Order Blocks while considering the SMART MONEY TRAP, traders gain a distinct advantage in the ever-evolving financial markets.
This document serves as an enriching guide to Structure Mapping & Demands and Supplies Premium, accentuating its pivotal role within the Smart Money Concepts framework. We invite users to immerse themselves in an experience that transcends the ordinary, delving into the intricacies that define successful trading. As you navigate the complexities of the market, these detailed insights become your compass, providing a rich and customizable user experience that unlocks the full potential of Smart Money Concepts. Embrace these tools judiciously, and empower your daily analysis with a wealth of information that truly holds its weight in gold.
Search in scripts for "inside bar"

[AlbaTherium] Structure Mapping with Demand & Supply Zones Structure Mapping v3.0 with Demand & Supply Zones
Introduction:
Structure Mapping v3.0 with Demand & Supply Zones marks a significant advancement in the realm of technical analysis and trading tools. This latest version of the indicator is designed to offer traders a comprehensive understanding of market structure and key demand and supply zones based on a refined version of Smart Money Concepts. All the concepts integrated into this method are meticulously defined, empowering users to map the market structure with confidence. With this indicator, there's no need to doubt the accuracy of your markings; it performs this task effectively. There are no hidden 'magic' properties underlying this indicator, ensuring that our users can independently verify each and every feature. It is our unwavering commitment to transparency that distinguishes us and makes us unique in the market.
Chapter 1: Understanding Market Structure
1.1 Market Structure Defined:
- Market structure forms the bedrock upon which successful trading strategies are constructed. It encompasses the highs, lows, and significant price levels that shape a market's behavior. Structure Mapping v3.0 provides a clear visualization of market structure, enabling traders to identify crucial support and resistance levels.
1.2 The Power of Structural Analysis:
- Structural analysis is a pivotal component of this indicator. By recognizing the fundamental elements of market structure, traders can make informed decisions regarding trend direction, potential reversals, and optimal entry and exit points.
1.3 Rules for Structure Mapping:
Let's explore some key definitions:
- Inside bars: These are candles that exist within the range of a preceding candle.
- Pullbacks: In an uptrend, a valid pullback occurs when the low of a previous candle's range (excluding inside bars) is breached, and the price continues to rise.
- Inducements (IDM): An inducement is a price level. In an uptrend, it is defined as the low of the latest pullback before the highest high. It is considered a liquidity area, often revisited by the market to access liquidity before continuing its upward movement.
- Break of Structure (BoS): In an uptrend, after surpassing an IDM , the highest high becomes a Confirmed structure high, or a Major High . If the price then closes above this Major High, a Bullish Break of Structure (Bullish BoS) is confirmed. Similarly, the lowest point between these movements becomes a Confirmed structure low or Major Low in a downtrend.
Change of Character (ChoCh):
In an uptrend, if the price falls below a Major Low, it indicates a shift in market bias from Bullish to Bearish, or a Bearish Change of Character.
Example of a bullish ChoCh:
Chapter 2: Demand & Supply Zones
2.1 Introduction to Demand & Supply Zones:
- Demand and Supply zones are critical areas on a price chart where significant buying or selling pressure is expected. This indicator highlights these zones, enabling traders to anticipate potential price reactions.
2.2 Identifying Demand and Supply Zones:
A Demand or Supply zone is the first candle of a pullback that leaves a Fair value gap.
Classic example of a trade with our indicator:
Conclusion:
Structure Mapping v3.0 with Demand & Supply Zones is a potent tool for traders seeking to gain an advantage in the financial markets. By focusing on market structure and identifying key demand and supply zones, this indicator equips traders with the knowledge they need to make informed decisions. Whether you're a novice or an experienced trader, this tool can enhance your technical analysis and trading strategies in the dynamic world of trading.
This document serves as a comprehensive guide to Structure Mapping v3.0 with Demand & Supply Zones, emphasizing its significance in understanding market dynamics and identifying critical trading zones. Applying these principles in your trading endeavors can lead to improved decision-making and more profitable outcomes.
[AlbaTherium] Structure Mapping & Order Blocks Advanced - Beta An Insight into Structure Mapping and Order Block Identification with Smart Money Concepts
Introduction:
Structure Mapping & Order Blocks Advanced - Beta serves as a fundamental pillar in the realm of Smart Money Concepts . This indicator adeptly charts the market structure based on a refined version of SMC while identifying Order Blocks. All the concepts embedded in this method are meticulously defined, offering users the ability to chart the market structure with heightened confidence. With this indicator, there is no need for excessive questioning of the accuracy of your markings; it diligently strives to perform this task effectively. There are no hidden 'magic' properties underlying this indicator, ensuring that our users can independently verify each and every feature. It is this commitment to transparency that sets us apart and makes us unique in the market.
In this discussion, we delve into the intricacies of Break of Structure , Change of Character , and SMART MONEY TRAP . We also introduce the concepts of Extreme Order Blocks , Decisional Order Blocks , and Smart Money Trap Order Blocks .
Chapter 1: Understanding Structure Mapping:
Let's begin with some definitions:
- Inside bars are candles that lie within the range of a preceding candle.
- Pullbacks occur in an uptrend when the low of a preceding candle's range (excluding inside bars) is breached, and the price continues to rise.
- Inducements (IDM) are price levels defined as the low of the latest pullback before the most recent high. They often act as liquidity points that the market revisits before continuing its move.
- Break of Structure (BoS):
In an uptrend, after surpassing an IDM , the most recent high becomes a Confirmed structure high, or a Major High . If the price then closes above this Major High , a Bullish Break of Structure (Bullish BoS) is confirmed. Similarly, the lowest point between these movements becomes a Confirmed structure low or Major Low in a downtrend.
- Change of Character (ChoCh):
In an uptrend, if the price falls below a Major Low , it indicates a shift in market bias from Bullish to Bearish, or a Bearish Change of Character .
Example of a bullish ChoCh :
Chapter 2: The Significance of Order Blocks:
Order Blocks (OB) play a pivotal role in Smart Money Concepts during entry points. Understanding what they represent and how to identify them is essential. For a Bullish/Bearish Order Block to be confirmed, specific conditions, including price imbalance and breaching the previous candle's high or low, must be met. We will delve into the finer details of identifying and trading Order Blocks, with an emphasis on the fact that price often reacts from Decisional Order Blocks, Extreme Order Blocks , and Smart Money Trap Order Blocks .
- An OB is the initial candle range of a pullback that creates a Fair value gap .
These are zones where proactive traders enter the market, resulting in significant price changes indicated by Fair value gaps . It is believed that when the price revisits these zones in the future, it tends to bounce back. This property makes Order Blocks excellent potential entry points.
Order Blocks are categorized as follows:
- Extreme OB : The first and lowest OB between the Major Low and Major High.
- Decisional OB : The most recent OB lower than the current IDM.
- Smart Money Traps : All OBs between Extreme and Decisional OB.
- Demand above IDM / Supply below IDM
Chapter 3: Understanding SMART MONEY TRAP (SMT):
SMART MONEY TRAP is a concept that brings clarity to the distinction between Structure and Order Blocks within Smart Money Concepts and is a unique feature of this indicator. While many Smart Money Traders base their trades on Structure and Order Blocks, it's crucial to recognize that Order Blocks serve as an additional confirmation for buy or sell decisions. Blindly trading based on Order Blocks is not advisable. Instead, traders should exercise patience and await other confirmations like inducement or Liquidity sweep before executing trades on Order Blocks. We will illustrate how this concept works in practice.
In the example above, the market largely disregards all the SMT s and responds favorably to the Extreme OB . This presents a promising trading opportunity, with a stop loss placed below the OB and a take profit set at the fill of the Fair value gap.
Conclusion:
Structure Mapping & Order Blocks Advanced - Beta embodies the essence of Smart Money Concepts , serving as a powerful tool for traders. This indicator effectively combines the elements of structure mapping and Order Blocks to guide trading decisions. By comprehending the dynamics of Impulsive Moves and Corrections, distinguishing between Bearish and Bullish Order Flow, and mastering the identification and trading of Order Blocks while considering SMART MONEY TRAP, traders can gain a competitive edge in the dynamic landscape of financial markets.
This document serves as a comprehensive guide to Structure Mapping & Order Blocks Advanced - Beta, highlighting its significance within the Smart Money Concepts framework. It is essential to apply these concepts judiciously to enhance trading.

Engulfing and emaThis is a Pine Script script that helps you see the Engulfing Candlestick and Inside Bar (Boring Candle) candle patterns on the TradingView chart, as well as drawing two Exponential Moving Averages (EMA). Here's a simple explanation:
1. **Candle Pattern**:
- This script identifies the Engulfing Candlestick pattern, which indicates potential changes to the price. If this pattern is detected, the script will show a green (for buy) or red (for sell) arrow above or below that candle.
- The script also identifies the Inside Bar (Boring Candle), which indicates the period area in the market. This candle will be the color you choose (default is orange).
2. **Moving Average (EMA)**:
- This script also plots two Exponential Moving Averages (EMA) on the chart. EMA is a tool that helps you see price trends more clearly.
3. **Risk Management**:
- This script calculates the Stop Loss (SL) and Take Profit (TP) levels for each Engulfing pattern. This helps you manage your trading risks.
- Labels are displayed on the charts for SL and TP, so you know where to place them.
With the help of this script, you can easily identify important patterns in the market and manage your risks better. Make sure to choose a demo account before using it in real trading.

Compression support&resistance [LM]Hello traders,
I would like to present you Compression support&resistance script. The idea behind is to look for areas of price compression(inside bar candles). Basically the S/R lines are created after three candles that are formed in certain pattern and volume conditions. First candle of pattern is usually the most volatile and fist inside bar after volatile candle high and low creates S/R lines in order to look for breakouts or for future bounces of the S/R line. Also by default volume has to be decreasing from candle to candle, although this condition can be controlled by setting.
It has various settings as my other S/R scripts for multi timeframe analysis. The current timeframe uses line API but for multi timeframe I use plot lines. There are two filters. Volume filter for declining volume of the pattern candles and volatility filter which renders line only in case that pattern occurs after some % change has happened within some lookback period.
Credit also for this indicator goes to @berkek as he took time to explain it to me.
Hope you will enjoy it,
Lukas
Swing PointsAn indicator that identifies Swing Points (highs and lows) and then determines highs and lows of those swings. Works on all timeframes.
This is not my invention. It is a generic concept that I picked up from the trading world.
First level swings are termed as Short term Highs and Short term Lows (STH and STL)
The second level swings are termed as Long term Highs and Long term Lows (ITH and ITL)
An STH is formed when the 2nd high is higher than the highs on either side.
An ITH is formed when the 2nd STH is higher than the STH on either side.
Likewise logic for lows.
An example, A bullish trend can be expected if an ITH level is taken out after a ITL is formed after the ITH.
Inside bars: Inside bars are ignored. They can be marked, turned off by default.
Also, a "X" is placed over a swing point if two consecutive swings form simultaneously. This is turned off by default.

EMA TEMA crossoverHello,
as usual recently the chart is bugged if I dare post a log one so I deleted and reposted...
here is a simple ema/team script that could allow you to catch trends.
You can play with parameters to get alerted of strong trends, or to detect trends early on.
I want to adapt this to an inside bar strategy, I am going to release that in a while, it is not my priority thought I am a countertrend trader, so I cannot say why, but what I have seen is inside bar breaks in very strong trends work very well.
There is a condition for this inidcator to work: you have to use it on a Heikin Ashi chart (the candle type, selectable in the area right of the timeframe).
Works sometimes. I advice backtesting any strategy before using. Idk maybe this could work decently, seems to have given big winners on bch recently. That huge one from 600 to 1800 lol. *3
* No one should pay for things this simple by the way...

Melak's All In One indicator(AIO)This script the following indicators.
Support and Resistance (lines)
MACD Crossover (Crossing arrow under each candle where MACD crosses)
50, 100, 200 Simple Moving Averages (orange lines)
10, 20 Exponential Moving Averages (turquoise and pink lines)
Doji reversals (turquoise candles)
Inside Bar (white diamonds under each inside bar candle)
TD time indicator (numbers on top of candles)

Three Bars Down and Inside Bar v2Updated Version of my Script. Script includes a Filter for stocks that are down three days in a row. Also it checks for oversold rsi and inside bars. Works best daily with stocks.

Inside 4+ Candles Box (Entry + Target + SMA Stop Logic)🔍 What This Script Does
This indicator detects price compression areas using 4 or more consecutive inside candles, then draws a breakout box to visually highlight the range.
Once price closes above the box, a long entry marker is plotted, along with:
🎯 Target line at 1x box size above the breakout.
❌ Stop-loss at the box low or at a dynamic SMA-based level if the box is too large.
🧠 Why It’s Unique
This script combines inside bar compression, breakout logic, risk control, and visual clarity — all in one tool.
It also cancels the setup entirely if price closes below the box low before breakout, avoiding late or false entries.
⚙️ Customizable Settings
Minimum inside candles (default = 4)
SMA length (used as stop if box is large)
Box size % threshold to activate smart stop
Entry, Target, and Stop marker colors
📌 Notes
For long setups only (no short signals).
Use on any asset or timeframe (ideal on 4H/1D).
This is not financial advice. Use with proper risk management.
Backtest thoroughly before live use.
Built with ❤️ by using Pine Script v6.
🇸🇦 وصف مختصر باللغة العربية:
هذا المؤشر يكتشف مناطق تماسك السعر من خلال 4 شموع داخلية أو أكثر، ثم يرسم مربعًا يحدد منطقة الاختراق المحتملة.
عند الإغلاق أعلى المربع، يتم عرض إشارة دخول وسطر هدف بنسبة 100% من حجم المربع.
كما يتم احتساب وقف الخسارة تلقائيًا إما عند قاع المربع أو عند متوسط متحرك ذكي (SMA) إذا كان حجم المربع كبيرًا.
الميزة الإضافية: إذا تم كسر قاع المربع قبل الاختراق، يتم إلغاء الصفقة تلقائيًا لتجنب الدخول المتأخر.
🧪 للاستفادة التعليمية والتحليل فقط. لا يُعتبر توصية مالية.

Volume Profile + Price Action Strategy (POC-based)This indicator combines volume dynamics, price action patterns, and a simplified Point of Control (POC) to highlight potential high-probability trade zones.
🔍 Key Features
POC-Based Logic
Plots the POC from the most recent closed 10-minute candle as a horizontal level for intraday structure.
Volume Spike Detection
Highlights unusual activity based on volume compared to the average of the last N candles.
Effort vs. Result Analysis
Based on Wyckoff-inspired logic:
Absorption: Large volume, small body → possible buyer/seller absorption
False Move: Small volume, large body → potential fakeout
Price Action Recognition Detects:
Inside Bars
Pin Bars
Engulfing Candles
Signal Highlights
🔺 Absorption Signals (below bar, teal triangle)
🔻 False Move Signals (above bar, orange triangle)
🔷 POC Line
⚙️ Customizable Inputs
You can control signal sensitivity with these inputs:
Volume Spike Multiplier
Raise to filter only extreme volume spikes
→ Recommended: 2.0 to 3.0 for cleaner setups
Absorption Body Ratio
Lower to detect only very small bodies (tight candles)
→ Try 0.3 to 0.4 for stricter absorption logic
False Move Body Ratio
Raise to catch only large candles on low volume
→ Use 2.0+ to filter weak moves
🧠 How to Use
Use in confluence with:
Support/Resistance
VWAP or moving averages
Session opens/closes
Best on 10-minute charts, but adjustable
✅ Signal Tuning Tips
Want fewer but cleaner signals?
Increase Volume Spike Multiplier: 2.5+
Decrease Absorption Body Ratio: 0.3
Increase False Move Ratio: 2.0+
Want more frequent signals?
Lower Volume Multiplier: 1.2–1.5
Raise Absorption Ratio: 0.6+
Lower False Move Ratio: 1.2–1.4
📊 Recommended Timeframe
Optimized for 10-minute charts
Works intraday, especially around session opens and POC re-tests
⚠️ Disclaimer
This script is for educational and informational purposes only. It does not constitute financial advice or a recommendation to buy or sell any asset. Past performance is not indicative of future results. Always do your own research and consult a licensed financial advisor before making trading decisions.
Use at your own risk.

Evolution Ranger V2This indicator plots 4H and 15M ranges and fractals.
The ranges are formed by the fractals and breaks of these candles
It also shows in a label if the trend BIAS on the 4H is "UC, NFT, FT or SFT" (Long or Short)
This will give the user a BIAS for the coming trading day. So when price breaks out of the plotted range, you'll have a new bias trend change
If it trading within the range, the trend bias remains the same
UC = unconfirmed Bias => wait
NFT= No follow through => Take only trades in the opposite direction from the break
FT = Follow through. => Wait for price to retrace to the other side of the 4H range, than trade in the direction of the BIAS
SFT = Strong follow through => Take trades in the direction of the BIAS anywhere in the 4H range
It draws all the range lines you need, so you don't have to.
4H Range (also on 15M), on the 15M; external and internal ranges.
Lots of possibilities:
-Plots the fractals, so you don't need another indicator. (Option to let the fractals repaint or not)
-4H Fractal Range lines and BIAS (previous fractal break line) and a 4H-BIAS label both on the M15 and 4H charts. No more switching between 4H and 15M charts needed.
-Option to switch on/off historic ranges.
-BIAS label shows 'UC, NFT, FT and SFT' - Long and Short
-Lots of alerts, break of 4H range, 15M external and internal ranges. You can go wild with it. Select 'Alert Once per bar'
-Option to show the 'Inside bar' and in a different candle colour.
-Option to toggle the repaint of fractal when the current candle has not closed yet.
-Option to show the BIAS label only for a confirmed bar while trading in live markets. When 'Off' the BIAS label repaints, but gives information on what might come, when the current bar closes.
-Most of the lines can be adjusted for colour and style to your own liking.

[FR]Custom Candles/FVG/nSideBarCustom Candles /FVG/ nSideBar
- I used this as a learning project for understanding plot()'s Better
- My goal was to see if I could use normal plots to cleanly plot FVGs on the chart using only plots with out and boxes/lines
The problem was if multiple FVGs were on back to back bars the plot fill would fill the line to the next FVG/Bar
I solved this by using 4 plots and alternating them if consecutive FVGs form
- 2 MODES
- Slim
- Normal
//////////////////////////////////////////////////////////////////////////////////////////////////////////////////////////////////////////////////////////////////////////////
-Slim
Uses 3 plotcandle() parts and divides the candle between body/wicks/open and close
by manipulating the ohlc inputs and the colors I was able to pretty make them full customizable
all components are customizable with up/down colors
-Normal
These are your normal candles but they are full customize able from components to individual up/down colors
--------------------------------------------------------------------------------------------------------------------------------------------------------------------------------------------------------------------------------------------------------
- FVGs
There are 2 FVG settings can be used with both MODES
- Big
These are the FVGs that use plots and since there isn't a 500 object limit on plots you don't need to manage them in the code and they are there how ever far you need to look back
- Slim
These use a Line and the width of the line can be adjusted for user preferences
--------------------------------------------------------------------------------------------------------------------------------------------------------------------------------------------------------------------------------------------------------
- INSIDE-BARS
These will change the color of the body of either SLIM or NORMAL Candles
--------------------------------------------------------------------------------------------------------------------------------------------------------------------------------------------------------------------------------------------------------
Drawing Snap Features Work Just Fine!
I suggest hiding your chart candles with the eye in the top left of the screen and moving the indicator to the top of your object tree
I understand that the candles in the chart pictures are impractical I was just demonstrating the functionality of the tool
Hope You Enjoy!!
FFriZz

Bar ChartI decided to change the type of charts for myself. Liked this one. When you add this script, the chart may slow down on a long history. Since this is my first script, I don't know how to make it easier.
A dot indicates a close, bars are displayed from high to low.
Black - inside bar
Blue outer bar
Green - high and low higher than the previous one
Red - high and low below the previous one

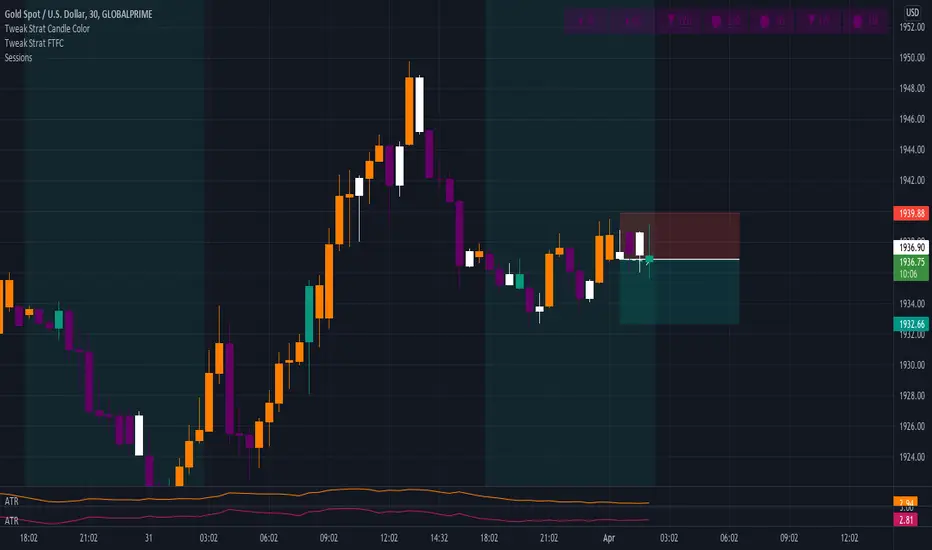
Tweak Strat FTFCThis script allows traders to view timeframe continuity on 7 timeframes at the top of the chart.
The trader selects 7 different timeframes, and the script will reflect whether the current candle for each timeframe is bullish or bearish (current price > the open OR current price < the open).
If a timeframe is currently bearish, the box will be purple.
If a timeframe is currently bullish, the box will be orange.
A circle in the middle of the box indicates that that timeframe is currently an inside bar (1).
An upward arrow indicates that that timeframe is currently a directional up bar (2u).
A downward arrow indicates that that timeframe is currently a directional down bar (2d).
A rectangle indicates that that timeframe is currently an outside bar (3).
NOTE: The color of the boxes is fixed. Traders MUST select a timeframe for EACH OF THE 7 FIELDS.
The M Score - Ultimate v5.0The M Score - Ultimate v5.0
*Introducing M score version 5.0*
Additions to the indicator:
1. 200 EMA Band (High-Low) added
2. Bottom left table - Shows All Time High/Lows (52 weeks) and % away we are from both. The values will not change in this table even if you change the timeframe.
3. Bottom center table - Performance matrix and a quick glance comparison with Nifty with different days of return. This will show if there outperformance or underperformance in the scripts and in which duration.
4. Top Right table - This indicator plots a table off to the right of the chart to help with determining timeframe continuity. A great edge is only taking trades where full timeframe continuity is in place (i.e. if you are going long, make sure other timeframes are also green).
Green candles have green colored boxes, red candles have red colored boxes.
Inside bars are represented by a circle - ⬤
Outside bars are represented by a tall rectangle - ▮
2-up bars are indicated by an up arrow - ▲
2-down bars are indicated by a down arrow - ▼
User defined options:
Pick any timeframe for the 4 boxes
Hope you will will like the efforts.

RM Timeframe ContinuityThis indicator plots a table off to the right of the chart to help with determining timeframe continuity. Per the Strat, a great edge is only taking trades where full timeframe continuity is in place (i.e. if you are going long, make sure other timeframes are also green).
In this script:
Green candles have green colored boxes, red candles have red colored boxes.
Inside bars are represented by a circle - ⬤
Outside bars are represented by a tall rectangle - ▮
2-up bars are indicated by an up arrow - ▲
2-down bars are indicated by a down arrow - ▼
User defined options:
Pick any timeframe for the 4 boxes
Choose whether to plot the highs/lows of the larger timeframe candles as horizontal rays on your chart (along with the associated colors)

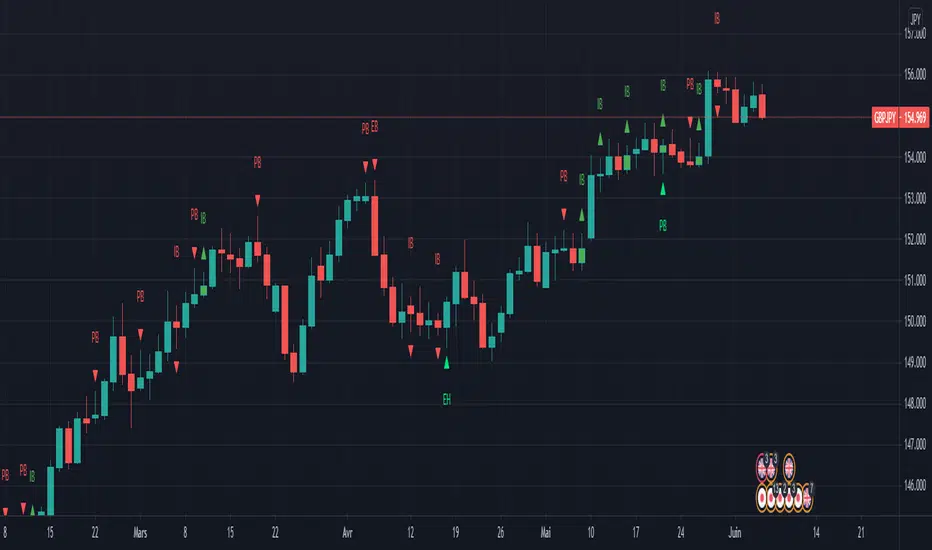
PA_PatternPrice Action Patterns
this script detects some of the favorite Price Action Pattern
For instance 3 pattern are available, you can select what pattern is shown in the configuration box :
- Engulfing
- Inside Bar
- Key Pin Bar (Key Pin Bar is Pin bar with a noise < 1/3 of the tail)
This script works on all time frame.
Keep in mind that Pattern detection is not a Price Action Strategy. Pattern have more weight in higher timeme.
In Next release
I willl try to add more Price Action pattern as Fakey, Tweezer, Marobozu, Rail Road Trail, ...
Nirvana Price ActionYou can set it according to your own needs
The required display can be opened ☑
Do not need to display can be closed ❌
I chose to turn them on by default: inside bars ☑ pin bars ☑ price action bar names ☑ price action bars ☑
Colors can be customized
I wish you a smooth transaction!
B3_HH_LL_Break Bar PainterThis is a simple Highest High or Lowest Low Breakout Painter.
Defaults in the order that they may color bars - checks top color first:
where n = your input length
BLACK = Outside Bar HHLL(n)
RED = Lower Low LL(n)
GREEN = Higher High HH(n)
BLUE = Inside Bar HHLL(n)
You may customize the colors in the indicator's settings-cogwheel on the chart.
Enjoy!
d^.^b

AnimalsI am a price action trader. I do not like lagging indicators but I love Fibonacci, Weekend, Bounce, Harmonics, Compression Patterns.
This indicator solves it all. It is free and exclusive for the members of the Unofficed Community.
Send me a private message here to get access.
Here is what is coded here -
Fractals:
Bill William's Fractals
Timed Top Fractals
Timed Bottom Fractals
Fractal Based Pivot Line
Bounce Strategy Indicators:
Higher High, Higher Low
Lower High, Lower Low
Inside Bar, Outside Bar
Up Bar, Down Bar
Bounce Chart
All Harmonic Patterns:
Bat, Alternate Bat
ABCD
Butterfly, Gartley, Crab, Shark
5-0 Patterns
Wolf
Price Action Patterns:
Head and Shoulders
Compression Triangle
Decompression Triangle

Book of Fish: Universal Deep DiveAhoy, Captain. 🏴☠️
Here is your official Angler’s Manual for the Book of Fish: Universal Deep Dive. This guide translates every pixel on your TradingView chart into nautical instruction so you can navigate the currents and land the big catch.
Print this out, tape it to your monitor, and respect the code of the sea.
________________________________________
📖 The Angler’s Manual: How to Fish
A Guide to the "Universal Deep Dive" Indicator
🌊 1. Check the Current (Background Color)
Before you cast a line, you must know which way the river is flowing.
• Green Water (Background): The tide is coming in. The broad market (Advancers) is beating the losers.
o The Rule: We prefer Longs (Calls). Swimming upstream against the green current is dangerous.
• Red Water (Background): The tide is going out. The market is heavy.
o The Rule: We prefer Shorts (Puts). Don't fight the gravity.
Captain’s Note: If your specific fish (stock) is Green while the water is Red, that’s a Monster Fish (Relative Strength). It’s strong, but keep a tight drag—if it gets tired, the current will drag it down fast.
________________________________________
🐟 2. Identify the Species (Candle Colors)
The color of your bars tells you exactly what strategy to deploy.
🟢 The Marlin (Ultra Bull)
• Visual: Green Candles. Price is riding above the Yellow Wave (20 EMA), and the Yellow Wave is above the White Whale (200 EMA).
• Strategy: Trend Following.
• How to Fish:
o Wait for the fish to swim down and touch the Yellow Wave.
o If it bounces? CAST! (Enter Long).
o Target: Let it run until the trend bends.
🔴 The Barracuda (Ultra Bear)
• Visual: Red Candles. Price is diving below the Yellow Wave, and the Yellow Wave is below the White Whale.
• Strategy: Trend Following (Short).
• How to Fish:
o Wait for the fish to jump up and hit the Yellow Wave.
o If it rejects? CAST! (Enter Short).
🟠 The Bottom Feeder (No Man’s Zone)
• Visual: Orange or Lime Candles. The price is fighting the trend (e.g., Price is below Yellow, but Yellow is still above White).
• Strategy: Reversion to Mean (Scalping).
• How to Fish:
o You are catching small fry here.
o Target: The Purple Anchor (VWAP) or the White Whale (200 EMA).
o Rule: As soon as it hits the Anchor or the Whale, cut the line and take your profit. Do not hold for a home run.
________________________________________
🎣 3. The Tackle Box (Signals & Icons)
These shapes are your triggers. They tell you when to strike.
Icon Name Meaning Action
▲ (Green Triangle) 3-Bar Play THE STRIKE. Momentum is breaking out after a rest. ENTER NOW. This is the sharpest hook in the box. Trend is resuming.
🔷 (Blue Diamond) Inside Bar The Nibble. Price is coiling/resting. Set a trap. Place a stop-entry slightly above the diamond (for longs).
⚫ (Black Dots) The Squeeze Calm Waters. Volatility has died. DO NOT CAST. Wait. When the dots disappear, the storm (and the move) begins.
9️⃣ (Red/Green Number) Exhaustion Full Net. The school has swum too far in one direction. Take Profits. A Red 9 at the top means the bull run is tired. A Green 9 at the bottom means the bear dive is ending.
✖️ (Purple Cross) RSI Snag Hazard. The engine is overheated (Overbought/Oversold). Don't add weight. The line might snap if you buy here.
________________________________________
🗺️ 4. The Map (The Lines)
• The Yellow Wave (20 EMA): Your surfboard. In a strong trend, price should surf this line. If it closes below it, the surf is over.
• The White Whale (200 EMA): The deep ocean trend. This is massive support/resistance. We generally do not short above the Whale or long below it.
• The Purple Anchor (VWAP): The average price. Prices love to return here when they get lost in the No Man's Zone.
• The Dotted Lines (PDH/PDL): The Horizon. Previous Day High (Green) and Low (Red). Crossing these means you are entering open ocean (Discovery Mode).
⚓ The Captain's Code
1.Don't force the fish. If the chart is chopping (Gray candles), stay on the dock.
2.Respect the '9'. When you see that number, lock in some gains.
3.The Trend is your Friend. Green Candles + Green Background = Smooth Sailing.
Fair winds and following seas.

Candle Identification + Cardwell Strength (w/ Slope Velocity)Identifies candle patterns pin bar, inside bar, outside bar, and shaved bars. The script also indicates the strength of the candle formation based upon Cardwell RSI principles, ADX, and price in relation to the VWAP.
The settings are available to the user to adjust for there specific style of trading.
